

WAVES RESEARCH

From Discretionary Research to Systematic Trading Evolution

A legacy Market Research initiative now transitioned into Quant-Driven Systems and Education.

Explore Current Work

Vishal Dalvi, CMT

B.E., MBA, CMT · Former Head of Research at Commtrendz Risk Management Services, handling Trading & Advisory for Commodities & Currency. Previously with Anand Rathi in Commodities & FOREX Advisory. Started career as a Software Engineer at Infosys Technologies.

Frequent speaker on CNBC Awaaz for views on Commodities and Currencies. Guest speaker at various MBA and BFM colleges under Mumbai University. Active trader employing Elliott Wave, Time Cycles, Fibonacci, and Harmonic Patterns across Equities, Commodities, and Currencies.

Now focused on Systematic and Quantitative approaches to markets — building Trading Systems, Backtesting frameworks, and educational resources through GreyBoxQuant.

B.E. MBA CMT
Qualifications
CNBC
Awaaz Speaker
Algo
Prop Trading Desk
Quant
Current Focus
Vishal Dalvi, CMT

How We Got Here

From discretionary Market Research to Systematic, Data-Driven approaches.

Earlier Phase

Discretionary Research

  • Technical analysis and chart-based research
  • Market commentary and trading calls
  • Portfolio management advisory
  • Media appearances (CNBC Awaaz)
  • Community building and mentorship
Current Phase

Systematic & Quantitative

  • Algorithmic Trading System development
  • Quantitative research and Backtesting
  • Data-driven decision frameworks
  • Trading system design and architecture
  • Quant education through GreyBoxQuant
We no longer provide advisory or stock-specific recommendations. All current work is system-based and educational.

What This Website Is Now

WavesResearch serves as a legacy archive and knowledge base.

📚

Archive of Past Work

Historical research, analysis, and market observations from our active years — preserved for reference.

💡

Educational Insights

Lessons, frameworks, and mental models developed through years of active market participation.

🧠

Thought Process & Frameworks

The thinking behind decisions — how market approaches evolve from discretionary to Systematic.

📈

Market Learning Resources

Curated content for those beginning their journey in understanding markets and Trading Systems.

From the Archive

Articles and frameworks written during the active WavesResearch years.

Educational Articles

Just Finished Your Trading Course? Nine Tips for Day One

Nine hard-won reminders for the trader stepping into live markets for the first time — on setups, capital, exits, risk and the role of the mind.

Sep 15, 2013 · Vishal Dalvi, CMT
Technical Analysis

The Elliott Wave Principle: An Obsessive Forecasting Technique

Elliott Wave offers a long-term perspective few tools can match — but used as a trading method, with bias and endless alternate counts, it can quietly wreck a P&L. A practitioner's candid take from the active years.

Aug 12, 2013 · Vishal Dalvi, CMT
Market Insights

Being Right Should Be Your Second Priority

Two simple ratios decide whether you make money in the markets — and most losing traders obsess over the wrong one. Why risk-reward matters more than being right.

May 20, 2013 · Vishal Dalvi, CMT
Browse the Full Archive
GreyBoxQuant — From Charts to Systems.

Explore current work in Quantitative and Systematic Trading.

Algo Trading System Design Backtesting Tools Quant Education
Visit GreyBoxQuant

The WavesResearch Journey

From a Market Research initiative to Systematic, Data-Driven trading. A timeline of evolution.

Early Career

Software Engineering & MBA

Vishal Dalvi started his career as a Software Engineer at Infosys Technologies for two years. While the tech foundation would later prove invaluable, his curiosity about financial markets led him to pursue an MBA and the CMT (Chartered Market Technician) certification in 2011–2012.

Industry Experience

Commtrendz & Anand Rathi

Served as Head of Research at Commtrendz Risk Management Services, leading Trading & Advisory for Commodities & Currency segments. Subsequently worked with Anand Rathi in their Commodities & FOREX Advisory department, building deep expertise in multi-asset Technical Analysis.

WavesResearch Era

Founded Waves Research & Advisory Pvt Ltd

Founded WavesResearch as an independent research house covering Equities, Commodities, Currencies, and Global Markets. Published daily research reports, built institutional-grade analysis products, and launched the Trainee-to-Trader Program — a unique course where students traded proprietary funds and earned 10% profit share. Became a frequent speaker on CNBC Awaaz for Commodities and Currency views. Conducted seminars at NL Dalmia Institute and multiple MBA/BFM colleges under Mumbai University.

Research & Services

Full-Service Research House

At its peak, WavesResearch offered: daily Equity/Commodity/Forex/Global research reports, fund management with multiple risk profiles, outsourcing research solutions for institutions (AMCs, DPs, Fund Houses, HNIs, Brokers), Harmonic Trading courses, and the proprietary Chart of the Week series. Clients included Motilal Oswal, Raga Securities, and individual traders across India.

Transition

Shift to Algo & Quant

A critical realization emerged: Discretionary Trading, despite years of refinement, still carried the weight of human bias. The software engineering background combined with deep market knowledge created a natural path toward Systematic approaches. The transition involved rebuilding the entire approach to markets from first principles — programming, statistics, and Quantitative methods.

Present

OHM Stock Broker + GreyBoxQuant

Today, the work has evolved into building and operating Systematic Trading systems. At OHM Stock Broker, Vishal partnered with industry veteran Amal Parikh to set up a proprietary Algo Trading desk, trading Indian as well as Global Markets with fully Systematic strategies. Alongside, GreyBoxQuant is the new home for sharing this work — covering Algo Trading, system design, Backtesting tools, and Quant Education.

Vishal Dalvi, CMT

B.E., MBA, CMT · Started as a Software Engineer at Infosys, then moved into financial markets through Commtrendz (Head of Research, Commodities & Currency) and Anand Rathi (Commodities & FOREX Advisory) before founding WavesResearch.

As an active trader employing Elliott Wave, Time Cycles, Fibonacci, and Harmonic Patterns, Vishal built WavesResearch into a full-service research house serving institutions, brokers, and individual traders. Frequent speaker on CNBC Awaaz, guest lecturer at Mumbai University colleges, and creator of the Trainee-to-Trader program that combined education with proprietary fund trading.

The philosophy evolved: markets reward those who combine deep understanding with Systematic execution. That realization drove the transition from discretionary to quant — now building GreyBoxQuant for Algo Trading, system design, and Quant Education.

Vishal Dalvi, CMT

Where the Journey Continues

GreyBoxQuant — From Charts to Systems.

GreyBoxQuant is the current home for Systematic Trading work, tools, and education.

Visit GreyBoxQuant

Archive

Browse our collection of Market Research, Technical Analysis, and educational articles published during the active years of WavesResearch.

Educational Articles

Just Finished Your Trading Course? Nine Tips for Day One

Nine hard-won reminders for the trader stepping into live markets for the first time — on setups, capital, exits, risk and the role of the mind.

Sep 15, 2013 · Vishal Dalvi, CMT
Technical Analysis

The Elliott Wave Principle: An Obsessive Forecasting Technique

Elliott Wave offers a long-term perspective few tools can match — but used as a trading method, with bias and endless alternate counts, it can quietly wreck a P&L. A practitioner's candid take from the active years.

Aug 12, 2013 · Vishal Dalvi, CMT
Market Insights

Being Right Should Be Your Second Priority

Two simple ratios decide whether you make money in the markets — and most losing traders obsess over the wrong one. Why risk-reward matters more than being right.

May 20, 2013 · Vishal Dalvi, CMT
Educational Articles

What We Taught: The WavesResearch Technical Analysis Curriculum

A look back at the technical-analysis curriculum taught during the active WavesResearch years — from Dow Theory and price patterns to Elliott Wave and risk management.

Nov 10, 2012 · Vishal Dalvi, CMT

Interviews, Seminars & Public Appearances

Vishal Dalvi, CMT appeared as a frequent speaker on CNBC for views on Commodities and Currencies, and conducted seminars at leading institutions.

Dukascopy TV Currency Forecast

JPY Currency War Concern

Vishal Dalvi shares his analysis on the Japanese Yen and currency war dynamics on Dukascopy TV's Forecasts segment. Discussion covers JPY trading opportunities and why lower levels present potential for long traders.

April 25, 2016 · 3:44 min Watch on Dukascopy →
Television CNBC Awaaz

Frequent Speaker on CNBC

Vishal Dalvi appeared as a frequent speaker on CNBC Awaaz, India's leading Hindi business news channel, providing expert commentary and analysis on Commodities and Currency markets.

Focus Areas
Gold, Silver, Crude Oil, USDINR, Currency Pairs
Approach
Elliott Wave, Harmonic Patterns, Inter-market Analysis
Active appearances during 2015–2017 · Waves Research & Advisory Pvt Ltd

Seminars & Speaking Engagements

🎓

Technical Analysis MDP Seminar

2-day Management Development Program at NL Dalmia Institute of Management Studies & Research, Mumbai. Covered Dow Theory, Candlestick Patterns, Elliott Wave, Fibonacci, Harmonic Trading, and Algorithmic Trading introduction.

Feb 27–28, 2016 · Mira Road, Mumbai
📚

Harmonic Trading Patterns Course

10–12 hour intensive course on Advanced Harmonic Patterns & Fibonacci Trade Setups. Covered 8 patterns (AB=CD, Bat, Gartley, Crab, Butterfly, Shark, Cypher, 5-0) with RSI integration and live chart analysis.

Recurring · Shreeji Plaza, Opera House, Mumbai
🏫

Guest Lectures at Mumbai University Colleges

Regular guest speaker at various MBA and BFM colleges under Mumbai University, teaching and creating awareness about Technical Analysis, market structure, and Systematic Trading approaches.

Multiple engagements · Mumbai University affiliated colleges

Published Research Reports

During its active years, WavesResearch published daily and weekly research reports across multiple asset classes. Sample reports are available for download.

📈

Equity Short Term Update

Daily in-depth analysis covering Nifty and select stocks with high-probability trade setups. Wave analysis combined with orthodox technical tools, Time Cycles, oscillators and Fibonacci retracement targets.

Published Daily · 2015–2017 📄 Sample PDF
🥇

Commodity Institutional Report

Daily forecasting of Gold, Silver, Copper, Crude Oil and agricultural commodities across MCX, COMEX, LME, and NYMEX. Detailed & simplified outlook incorporating global analysis and currency data.

Published Daily · 2015–2017
💱

Forex Daily Report

Detailed analysis of major cross currencies (USD, EUR, GBP, JPY) along with Dollar Index. Short to medium term views on USDINR, EURINR, GBPINR, JPYINR with wave theory and orthodox indicators.

Published Daily · 2016–2017 📄 Sample PDF
🌎

Global Market Forecasting

Weekly forecasts of US, European, and Asian equity markets. Top-down sectoral and country analysis examining how government actions across the globe impact inter-related markets.

Published Weekly · 2013–2017

Special Research Reports

📄

Indo-Pak Equity Update

Special report on geopolitical impact on equity markets · 17 pages

📄

Dollar Rupee: A Fast & Furious Move

USDINR volatility analysis with wave structure · 4 pages

📄

Tata Steel: Technical Analysis

Individual stock research with Elliott Wave count

📄

Technical Analysis Overview

WavesResearch Technical Analysis methodology document

📄

Technical Analysis Course Material

Course curriculum & training content · 10 pages

📄

FAQs

Frequently asked questions about WavesResearch services

📄

Nifty Trading System

Proprietary Nifty Trading System by Vishal Dalvi · 22 pages · 2 MB

📄

Annual Global Outlook 2013

Global markets annual forecast · 14 pages · 910 KB

📄

Equity Annual Outlook 2013

Indian equity markets annual forecast · 20 pages · 466 KB

📄

Annual Commodity & Currency Report

Comprehensive commodity & forex annual analysis · 14 pages · 1 MB

📄

BSE Auto Sector Analysis

Sectoral analysis of BSE Auto index · 1 MB

📄

Metal Sector Update (Mar 2014)

Metal sector technical & Fundamental Analysis · 687 KB

📄

Lead & Zinc Update (Jan 2014)

Base metals analysis with wave counts · 4 pages · 256 KB

📄

Commodity Research Overview

WavesResearch commodity research services & methodology · 588 KB

📄

IIP (Index of Industrial Production) Analysis

Macro-economic analysis & market impact · 10 pages · 755 KB

Featured Series

Chart of the Week

One of our most popular recurring features. Every week, a single chart was selected and deeply analyzed — covering patterns, wave counts, Fibonacci levels, and actionable context. Subscribers received these via email, and they were published on the website for free access.

"Your 'Chart of the Week' research on website is really helpful, request you to keep such more charts on website regularly." — Mahendra, Subscriber

50+
Charts Published
4
Asset Classes Covered

All articles are part of our historical archive and are for educational purposes only. For current work in Systematic Trading, visit GreyBoxQuant.

Disclaimer

General Disclaimer

WavesResearch (wavesresearch.com) is an archived Market Research initiative. The website and its content are maintained for educational and informational purposes only. WavesResearch is not an active business and does not provide any financial services.

No Investment Advice

The content on this website does not constitute investment advice, financial advice, trading advice, or any other form of professional advice. Nothing on this website should be interpreted as a recommendation to buy, sell, or hold any financial instrument or security.

No Buy/Sell Recommendations

WavesResearch does not and will not provide:

  • Stock tips or trading calls
  • Buy, sell, or hold recommendations for any security
  • Portfolio management or advisory services
  • Specific investment strategies or suggestions
  • Algorithmic Trading Systems or signals for purchase

Not a SEBI-Registered Advisor

WavesResearch and its founder are not registered with the Securities and Exchange Board of India (SEBI) as an Investment Advisor, Research Analyst, or in any other capacity. No content on this website should be construed as coming from a registered financial professional.

Educational Purpose Only

All articles, research notes, market observations, and other content on this website are published solely for educational and informational purposes. They represent historical observations and personal learning — not actionable financial guidance.

No Guarantee of Results

Past observations, analysis, or any content on this website do not guarantee future results. Financial markets involve risk, and past performance is not indicative of future returns.

Consult a Professional

Before making any investment or trading decisions, please consult with a qualified, SEBI-registered financial advisor or investment professional who can assess your specific financial situation, risk tolerance, and investment objectives.

Limitation of Liability

WavesResearch and its founder shall not be held liable for any losses, damages, or consequences — financial or otherwise — arising from the use or interpretation of content on this website. You use the information on this website at your own risk.

If you have any questions about this disclaimer, please reach out via the contact information provided on GreyBoxQuant.

← Back to Archive

The Elliott Wave Principle: An Obsessive Forecasting Technique

"Isn't good forecasting coherent with good trading?" The honest answer is no. Trading — and making money from trading — is a far different ball game from merely forecasting. Even if someone could exactly predict the highs and lows of the next intermediate move over the coming week, I could not guarantee they would make money.

The Elliott Wave Principle is the only technical-analysis technique that offers a genuine long-term perspective — which contradicts the common belief that Technical Analysis works only in the short term. Most other tools are limited. Classical patterns such as the head & shoulders, rectangle or flag work only until their targets are met; after that they say nothing about the next move. Momentum indicators like RSI and MACD are price-following — they measure how overbought or oversold a market is, but they cannot forecast. With Elliott Wave, once you know where you stand in the pattern, you can map the possible moves ahead. And because the pattern is fractal in nature, the same logic applies from a one-minute chart to a one-decade view.
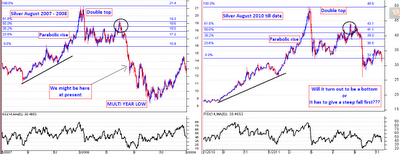
Silver daily chart showing the fractal nature of price
Silver's fractal nature — the same wave structure recurs across degrees of trend.

I was a strong propagator of this theory and used it in my trading for more than seven years. The curious part: the amount I relied on it fell every year, while my trading P&L grew. Not because it became less significant, but because I accepted its limitations — sticking to a few important rules and combining it with other tools to find better setups. What I want to focus on here is how the Elliott Wave Principle, used wrongly, can hamper your trading.

It Was Never a "Trading Technique" in the First Place

When R. N. Elliott discovered this theory in the 1930s, he was simply describing how market prices unfold in a specific pattern. He never said "buy here" or "sell there". It was an explanation of how the repetitive behaviour of market participants causes prices to trace similar patterns across time frames. A simple reading of impulse and corrective moves can reveal the larger direction of the market. Only later did people start using the theory as a trading methodology.

The "Alternate Wave Count" Gimmick

Elliott was smart. He devised a theory that is always "right", no matter where the market eventually goes. On any stock or index there are at least two — and often seven to ten — valid wave counts. So there is always at least one bullish alternate and one bearish alternate. Pick the bullish count, buy, and watch the market fall, and you lose money — but has the theory been wrong? Not at all; it had clearly flagged an alternate bearish count. Combine all the counts and some say up, some say down, some say sideways. Wonderful information: the market may go up, down, or sideways!
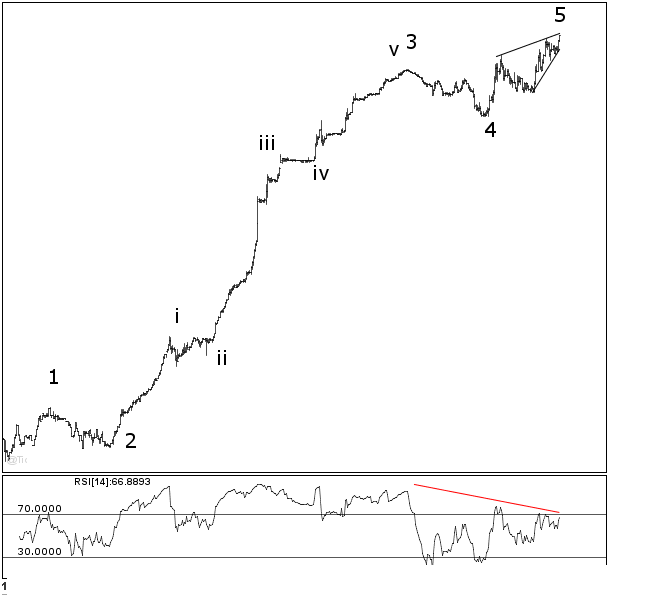
A wave count marked on a price chart
A wave count on a chart — the same move can often be labelled more than one way.

"The 5th Wave Is Near Completion"

Show a newcomer a chart with a rally and, invariably, they will try to fit five waves into it and announce: "We are completing the 5th wave; a correction should begin now." The 2009–2010 rally in the Sensex was a classic trap for exactly this reflex.

Even a Textbook Impulse Can Be Fully Retraced

In theory, after a clean impulse down, the corrective bounce should not exceed the start of that impulse before a new low arrives. Yet there are countless examples of impulsive moves, up and down, being fully retraced without ever completing the pattern. In 2008, freshly introduced to the theory, I read that Robert Prechter — who introduced most of us to Elliott Wave — expected the Dow Jones to fall toward 500 while it traded in the 7,000–8,000 range. I am grateful to him for teaching us this beautiful theory, but with respect, the market went on to more than double from its 2009 lows. Of course, the theory keeps provisions — the irregular B, the expanded flat — that justify such moves after they happen. As I said: the theory is always right, irrespective of where the market goes.

The Danger of Bias

Holding a bias toward one wave count is the most fatal thing you can do while trading with Elliott Wave, especially on reversal trades — if the market shoots the other way, you can miss the entire next move. Stay flexible and lean on other tools to gauge direction. Remember, too, that a five-wave move can later be recounted as a three-wave move. The crux of the theory is deciding whether a move is a five-wave impulse or a three-wave correction — yet the very same move, once marked as an impulse, can be re-marked as a correction just to make a count work. Bias makes you count whatever confirms your view.

So Should You Use It?

Despite its drawbacks, Elliott Wave remains one of the best techniques for reading market structure and direction. If you intend to trade with it, accept the limitations: find your setups in combination with tools like RSI and Fibonacci. If you are purely in it for research and enjoy putting wave counts on charts, play away. But if you want to make money with the theory, know this — you cannot use it alone.

This article is part of the WavesResearch technical-analysis archive and does not constitute trading advice.

← Back to Archive

Being Right Should Be Your Second Priority

The entry hurdle into the business of trading and investing is among the lowest of any business. You can open a demat account in a couple of days and you are all set. Short-term gains give a sense of instant gratification and the feeling that money can be made fast. But the key to lasting in this game is discipline and risk management.

Two simple ratios decide whether you make or lose money in the markets:

  • Success ratio — how often you are right.
  • Risk-reward ratio — how much you gain when right versus how much you lose when wrong.

Poor traders fixate on the first. They hunt for a study that maximises the success ratio while neglecting the risk-reward equation entirely.

A Simple Example

Imagine 100 trades, booking profit at +200 and cutting losses at -100 — a risk-reward of 1:2. An expert with a 70% success ratio makes 200 seventy times (14,000) and loses 100 thirty times (3,000): net profit 11,000. Now take someone with coin-toss odds: 50 wins of 200 (10,000) and 50 losses of 100 (5,000) — still a net profit of 5,000.

The point is striking: even being right only half the time, you can be net profitable. The reason is the risk-reward setup — you lose only half of what you gain when right. In this scenario you break even at a success ratio of just 33.33%. Only below that do you start losing money.

In real life, most losing traders do the exact opposite. They book profit at +100, afraid of giving it back, then lose 200 on a bad trade, holding on in hope it returns. With that behaviour, even a 66.66% success ratio only reaches break-even.

Most mechanical trend-following systems have a success ratio below 50% — but they keep losing trades small, to be more than paid for by the occasional big winner.

It Comes Down to Emotion

Emotion is at the heart of this. As humans we want to win and cannot accept being wrong. Traders take losing trades personally, attach to them, and begin to doubt their methods. But we are forecasting the future, which is only a probability — some trades will go wrong. No methodology delivers a 100% hit ratio. Survival comes from risk management and a method with risk-reward in your favour.

Traders fear that profits will vanish, so they cut winners fast. They hope a loser will come back, so they hold it. To succeed, simply reverse these two emotions: fear that a loss can become a far bigger loss — and cut it early — and hope that a profit can become a far bigger profit — and let it run.

This article is part of the WavesResearch market-insights archive and is for educational purposes only — not investment advice.

← Back to Archive

Just Finished Your Trading Course? Nine Tips for Day One

You have just finished your trading course. Here are nine things worth keeping in mind on day one in the live markets.

  1. Trade setups, not markets. You don't trade stocks, commodities or currencies — you trade setups. Many traders fixate on a stock they lost money in and try to win it back from the same name. Keep ego aside; opportunities float across the markets every day. Build a few setups that suit you and follow them religiously. Do not trade randomly.
  2. Capital is king. "Sar salaamat toh pagdi pachaas." If your trading capital is intact, there is always tomorrow. The simplest protection is to fix a percentage-of-capital stop for every trade.
  3. Mind your time frame. Whatever time frame you trade, always confirm the trend on the time frame one degree higher.
  4. Have an exit strategy. If you do not have one, stop trading altogether. Entering a trade is the easiest thing in the world — you could flip a coin. What separates a good trader from a bad one is the exit.
  5. Risk management is widely misunderstood. It is not merely placing a stop-loss. It is the statistical understanding of how your success ratio relates to your risk-reward ratio across all trades. Track three numbers to know why your P&L looks the way it does: average profit per winning trade, average loss per losing trade, and success ratio.
  6. Good execution comes from a clear plan. You research for hours over the weekend and finally pick next week's stock on the daily chart. Then one jerk on the 15-minute or hourly chart makes you panic and exit — only to watch the stock move your way days later. Good execution happens only when, at entry, you already know exactly where you will exit or book profit. However good the research, execution in live markets is what separates a trader from a research analyst.
  7. Train your mind. Your attitude, frame of mind — even your breathing and your thoughts — affect your P&L more than you think. A run of bad trades dents confidence and breeds self-doubt. Self-belief and a positive attitude, paired with sound strategies and risk management, take you a long way.
  8. Build at least one trend-following system. If you intend to trade full time, you need at least one trend-following system to keep you in the market objectively — whichever way it moves, regardless of your personal view. It is the basis of consistent, stress-free, long-term capital appreciation.
  9. Keep yearly, monthly and weekly targets. A trader without considered targets is a gambler in a casino chasing the thrill. Set long-term goals and work backwards to weekly and daily targets to plan your risk and your trades.

And a blunt closing thought: if active trading cannot earn you meaningfully more than a simple index fund or fixed deposit would, the stress and risk may simply not be worth your time.

This article is part of the WavesResearch educational archive and does not constitute trading advice.

← Back to Archive

What We Taught: The WavesResearch Technical Analysis Curriculum

During the active years, WavesResearch ran a structured technical-analysis training programme. It is preserved here as part of the archive — a snapshot of the topics, and the order in which they were taught, for anyone curious about how the discipline was approached. The programme is no longer offered; current educational work continues at GreyBoxQuant.

Foundations

The beginner track started from first principles — what Technical Analysis is, and how it differs from Fundamental Analysis — before working through the building blocks:

  • Introduction to Technical Analysis; fundamental vs. technical
  • Types of charts and scales (arithmetic and semi-log)
  • Dow Theory — trend structure and its three phases
  • Candlestick patterns
  • Trendlines and channels
  • Moving averages — simple, weighted and exponential
  • Price patterns — rectangles, head & shoulders, double tops and bottoms, triangles, flags, wedges and gaps
  • Indicators — ROC, RSI, MACD and ATR
  • Fibonacci retracements and projections
  • An introduction to the Elliott Wave Principle

Going Deeper

The advanced track built on the foundations with the tools that took longer to master:

  • The Elliott Wave Principle in detail — extensions, fifth-wave truncation, alternation, wave equality, channelling and diagonals
  • Corrective structures — zig-zags, flats, triangles and combinations
  • Ratio analysis for finding price targets
  • Confirming wave counts with RSI, Fibonacci and other indicators
  • Inter-market analysis
  • Applying wave counts across stocks, commodities and currencies
  • Risk management and position sizing

The Thread Running Through It

Whatever the topic, the emphasis was always the same: technique is only half the job. Reading a chart well is one skill; making money from that reading — through discipline, exits and risk management — is another entirely. That conviction is what eventually pushed the work from Discretionary Analysis toward Systematic, Quantitative methods.

This article is part of the WavesResearch educational archive. For current work in Systematic Trading and Quant Education, visit GreyBoxQuant.